June 2022 Special Report: Texas Market Overview
More Households and Companies are Calling Texas Home, Lifting Self-Storage Needs and Drawing New Investment
Lifestyle changes and improving economy boost storage needs.
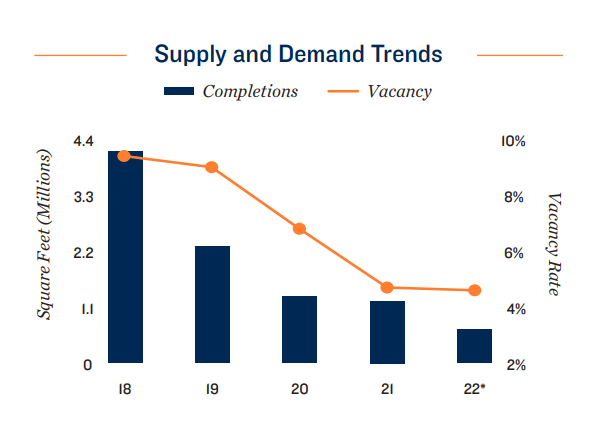
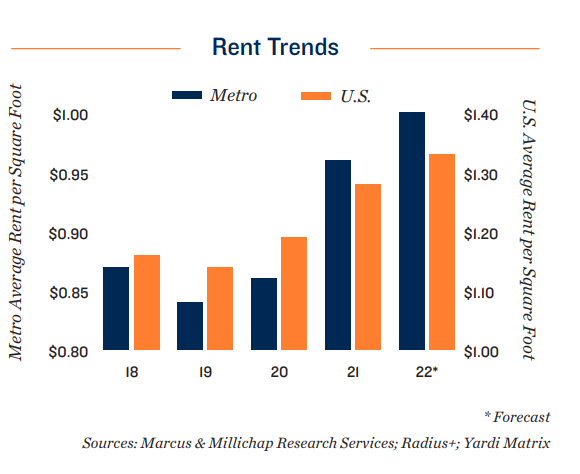
By fostering a broad shift to remote working and enhancing population mobility, the health crisis galvanized self-storage demand across the country. The national vacancy rate fell from 10.1 percent in March 2020 to a record low of 5.5 percent a year later, while asking rents recouped four years of construction-induced losses within the same 12-month span. As the pandemic lessens and old routines return, self-storage needs remain high. Workers are still in the process of returning to offices, with firms utilizing hybrid strategies. As such, many temporary home offices are persisting. At the same time, a recovered labor market is encouraging accelerated household formation and relocation, also driving new self-storage renting.
Future supply an important present-day consideration.
The migration of companies and households to Texas positions self-storage properties in the state on a favorable long-term trajectory. Property fundamentals have also been aided by a relative slowdown in construction activity, as the health crisis constrained the supply of raw materials and labor. Those hurdles are now receding, however, and robust operations are prompting renewed consideration of self-storage projects. While near-term arrivals still trail recent years, expanding Texas inventories by less than the 3.0 percent national pace this year, the volume of potential space under consideration is climbing. If all of these projects come to fruition, it could reintroduce some new supply pressure for a limited time.
Population growth leads to standout property performance in Texas.
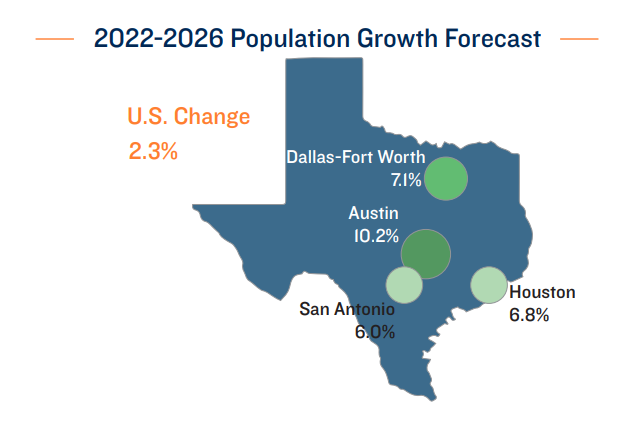
Metros across Texas continue to welcome new residents at a rapid clip. Austin, Dallas-Fort Worth, Houston and San Antonio have collectively added over 40,000 new households since 2019. Companies looking to bolster staff counts in a competitive labor market have taken note of the state’s lifestyle appeal and are relocating or expanding in Texas. Formerly California-based AECOM, Charles Schwab and DZS have all relocated to Dallas-Fort Worth, while Tesla’s move to East Austin is a nascent economic catalyst. Simultaneously, local industries are expanding. The war in Ukraine has disrupted energy availability, placing an emphasis on domestic fuel sources. The new job opportunities are, in turn, enticing even more household relocations, driving self-storage demand. Vacancy rates in the major Texas metros are all below the U.S. average, while asking rents have climbed above pre-pandemic levels by over 14 percent in certain locales.
Sales activity strong, but complicated by climbing interest rates.
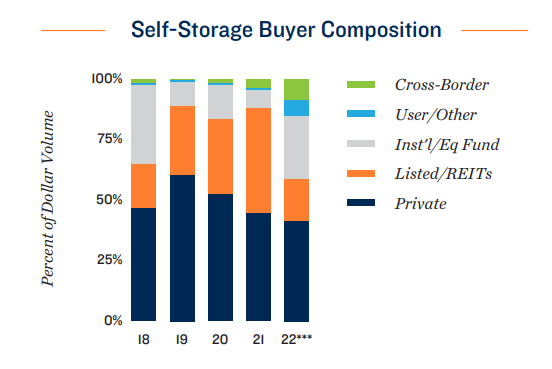
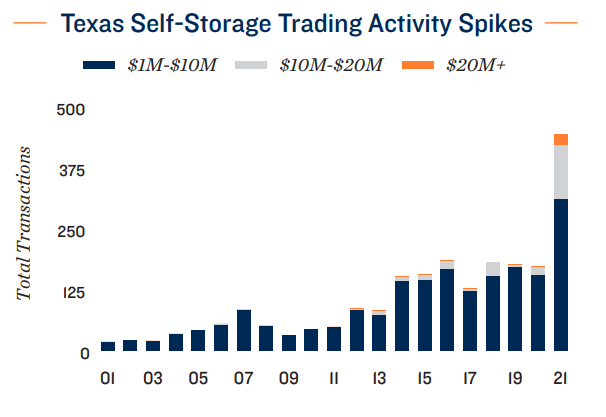
Robust fundamentals and favorable demographic trends boosted investment activity across Texas last year. Statewide, transactions set a new record, up over 110 percent in 2021 versus the year before. This is well above the 70 percent jump recorded nationally. While sales activity moderated in the opening quarter of 2022, Texas still reported roughly three times the number of trades typical for a quarter between 2015 and 2019. The slowdown was driven by compressing cap rates, which average in the high-5 percent zone but can drop lower, and a growing expectations gap between buyers and sellers. This dynamic has only become more complicated as interest rates rise. To preserve margins, more institutional investors are looking toward the state’s growing tertiary markets. As REITs slow acquisitions, private companies and investor groups have become more active. If sellers and buyers align closer, it could inch up cap rates, facilitating more sales.
AUSTIN
Rapid Corporate Expansions and Population Growth Support Continued Supply Increases
Young and educated labor force bolsters tech sector, storage usage.
As one of the country’s more prominent destinations for Silicon Valley expatriates, new offices from Meta, Apple and Amazon opening in 2022 showcase Austin’s vibrant tech sector. In addition to boasting the highest rate of population growth among major markets this year, the metro also contains the nation’s most rapidly growing 20- to 34-yearold cohort. This demographic, predisposed to more active lifestyles and a tendency toward downsized living spaces, are also avid storage users.
• Supply additions this year will be just half of the pre-COVID-19 trailing five-year average, but the 625,000 square feet set to be completed this year will grow inventory at a 2.7 percent clip, the fastest rate among Texas metros.
• In addition to easing development activity since the onset of the health crisis, net migration is continuing at a steady rate, maintaining a high level of demand for storage space. Metro vacancy will tighten to 5.3 percent by the end of 2022.
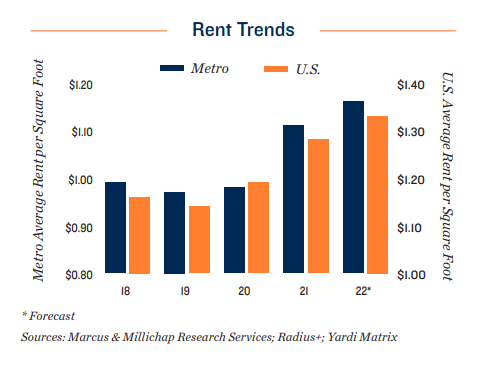
• In the wake of last year’s 13.3 percent surge, Austin will retain the fastest-growing rent in Texas. The marketed rate will increase 4.5 percent in 2022, ending the fourth quarter at $1.16 per square foot.

SAN ANTONIO
Oil Prices and Key Demographic Gains Stimulate Hiring; Low Development Keeps Vacancy Below Pre-2020 Rate
Growth in the energy and health care sectors translates to population gains.
Further development along the Eagle Ford Shale formation should create more positions in the metro’s energy sector, which, in tandem with record oil and gas profits, will draw more migration to the area. The market’s quickly growing 65 plus demographic should also translate to more health care positions, which constitute San Antonio’s second-largest private employment segment. Expansions in these industries will support a 1.4 percent jump in population this year, more than doubling the national rate.
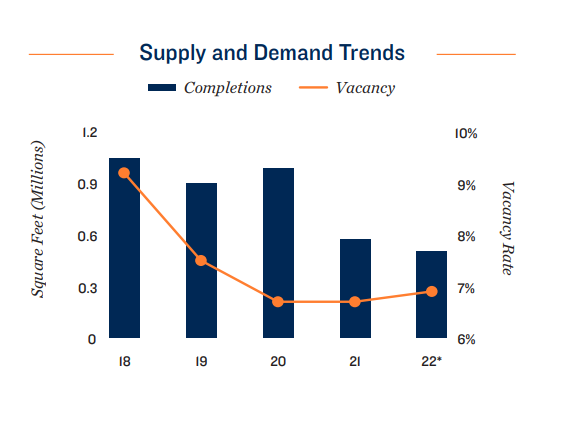
• The 500,000 square feet estimated to be completed this year falls slightly below 2021’s total to represent the lowest annual delivery volume since 2012, falling short of the trailing half-decade completion average by over 300,000 square feet.
• After falling 250 basis points between 2018 and 2021, vacancy will inch up 20 basis points to 6.9 percent by the end of the year. While local population gains well exceed the national average, in-migration is lower compared to other Texas metros.
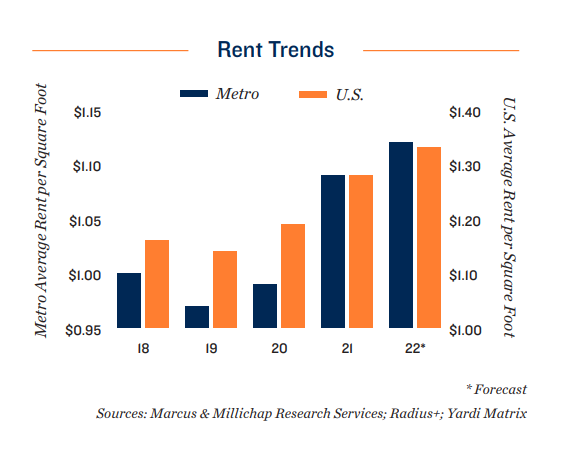
• A slight increase in availability will do little to restrain rates. A 2.8 percent increase will bring the average asking rent to $1.12 per square foot, a multiyear high. Rents here have increased 15.5 percent since the start of the health crisis
DALLAS- FORT WORTH
New Firms Drawn to Diverse Metroplex Economy; Market Retains Nationally-Leading Development Pipeline
Corporate relocations boost in-migration.
The metro’s pool of employers is growing, with Uber and Verizon among the several Fortune 500 operations expanding into the Metroplex. Increasing investment will contribute to high net in-migration this year, with nearly 72,000 anticipated new arrivals outpacing the 2021 rate by more than 20,000. On the supply side, a long-term development schedule exceeding 3 million square feet places the market first nationwide for projects. All square footage underway here will add four times the space of the next largest Texas metro pipeline.
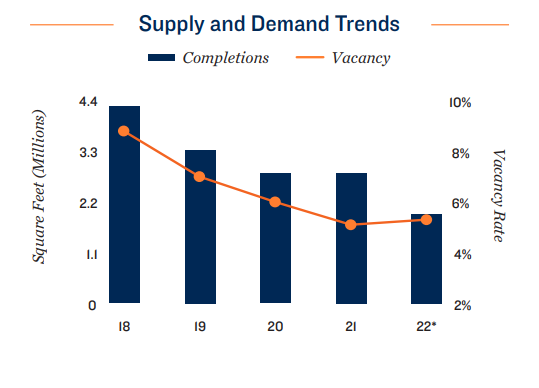
• Of the current construction schedule, 1.9 million square feet will come online this year. A further 2.2 million square feet are currently in the approval or planning process, as developers are still seeking to break ground on new projects.
• Despite a notable construction pace, the sharp uptick in migration to the metro will restrain upward-trending vacancy as many of these new arrivals seek out storage units. Metro-wide vacancy bumps up 20 basis points to 5.3 percent.
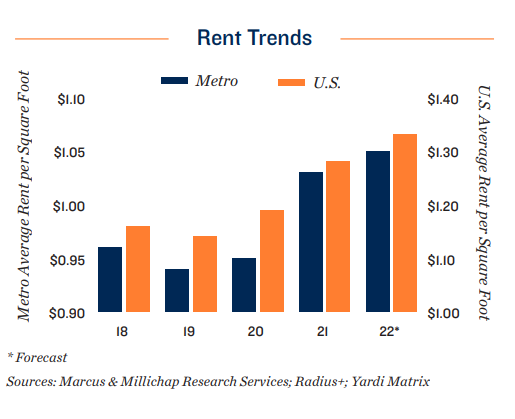
• Asking rents will build on last year’s 8.0 percent increase, growing in 2022 at a more sustainable 2.3 percent clip. The metroplex will report its highest mean yearend marketed rate since 2016 at $1.05 per square foot.
HOUSTON
Energy and Supply Chain Hurdles Give Boost to Important Metro Employers, Supporting Storage Demand
Geopolitical developments support key metro industries.
One of the globe’s top oil and gas hubs, surging energy prices resulting from economic sanctions should bolster sector recruitment. Supply chain bottlenecks along the West Coast have also redirected significant container traffic into the Gulf of Mexico, facilitating logistics hiring as record tonnage enters Houston ports. As these industries comprise some of Houston’s larger hiring segments, enhanced recruitment should be a boon for storage usage moving forward.
• Developers are expected to finalize just 665,000 square feet of space in 2022, marking the first calendar year with less than 1 million new square feet since 2013. Nearly 250,000 square feet are currently underway in the city of Tomball.
• A narrowing development pipeline will facilitate a fourth consecutive year of declining vacancy as Houston is expected to receive over 56,000 new residents from other metros. Marketwide availability will contract to 4.6 percent by year-end.
• Tempered construction activity, in tandem with a growing population and employment base, will support rents breaching the $1 per-square-foot threshold for the first time since 2015, as the mean asking rate hits $1.01 per square foot.
Higher Interest Rates Complicate an Otherwise Favorable Capital Markets Climate for Self-Storage
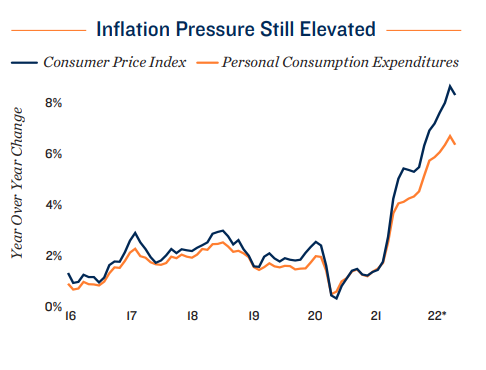
Federal Reserve commits to higher lending rates amid rapidly rising prices.
Persistently elevated inflation propagated by beleaguered supply chains, geopolitical turmoil and a tight labor market have prompted the Federal Reserve to substantially tighten monetary policy. As of June, the Federal Open Market Committee has raised the Federal Funds Rate target 150 basis points to a range of 1.50 percent to 1.75 percent. The central bank intends to hike rates multiple more times this year and next, likely extending the target range above 3 percent. Starting in June, the Fed also began to reduce its balance sheet after substantially increasing asset purchases in 2020 and 2021. This quantitative tightening process, together with a higher overnight lending rate, is applying considerable upward pressure to interest rates. Climbing above 3.4 percent in mid June, the yield on 10-year Treasuries has more than quintupled from its August 2020 low, while rates on single-family 30-year fixed mortgages have also risen over 60 percent so far this year, surpassing 5.5 percent. These higher borrowing costs are now impacting commercial financing.
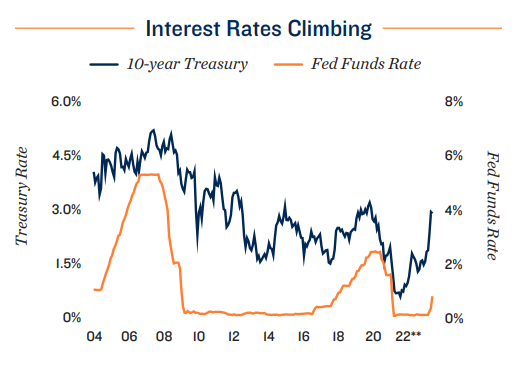
Lenders active in self-storage sector, but adapting to higher interest rates.
Capital continues to be readily available for self-storage investment transactions, as the sector’s recent historical marks in vacancy and rent growth are viewed favorably by financiers. Nevertheless, capital costs are climbing, impacting terms. Banks, ranging from local to national in scope, continue to be the most active lenders in the space. As of early June, all-in interest rates for bank-issued debt was generally at 5 percent or below, although criteria change depending on individual asset quality and location, as well as the experience of the buyer. Lenders have generally tightened underwriting criteria, with a greater focus on debt service coverage. Financiers are looking for debt coverage ratios above 1.2 percent, equating to lower loan-to-value ratios at or under 60 percent. Bridge financing is accessible for greater leverage, at higher rates. Capital is also available for construction projects, particularly for facilities in Texas and the Southeast, where per-capita space demand tends to be higher than average.
